
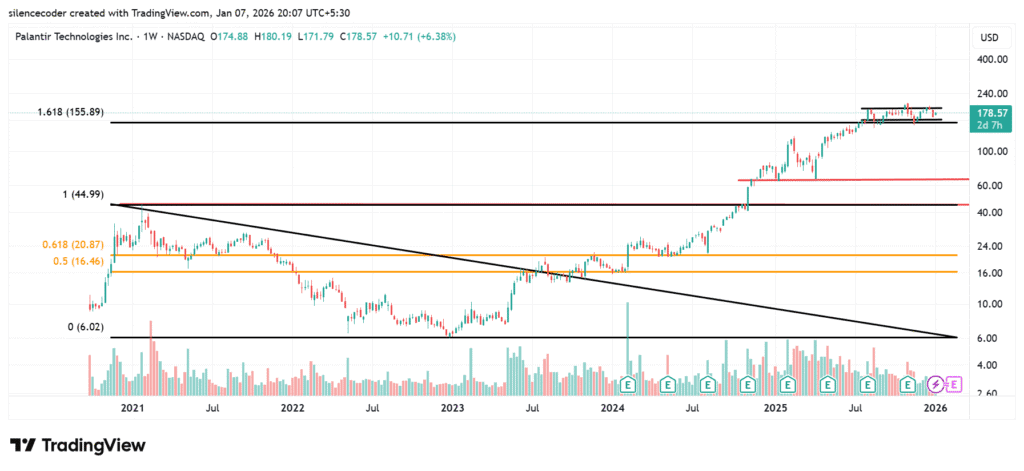
Weekly Chart:
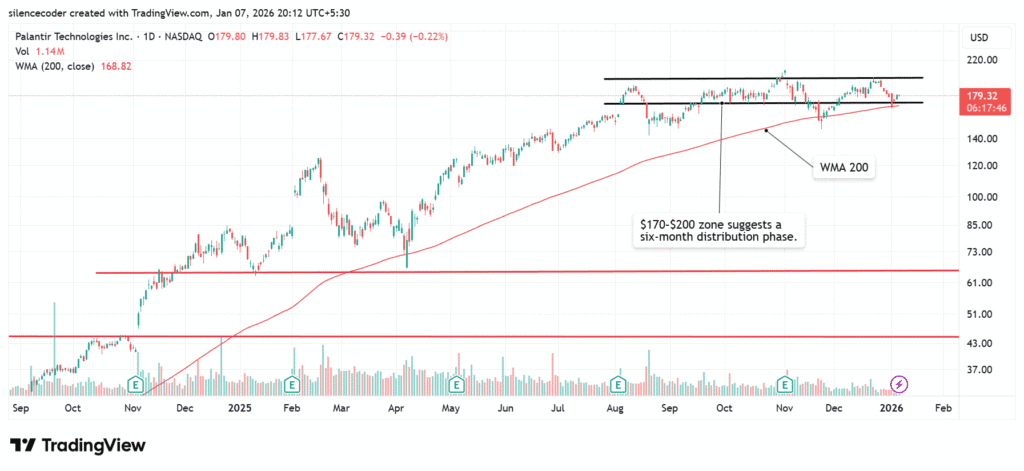
Daily Chart :
Commentary ==>
# TECHNICAL ANALYSIS REPORT
- EXECUTIVE SUMMARY
The instrument is trading within a defined daily range with the $200-level acting as a major supply barrier.
Repeated retests and failure to break above the historical high of $206 indicate exhaustion of momentum.
Recent price action shows a large bearish candle on 2 January 2026 followed by an inside candle on 5 January 2026, signaling continuation risk.
The rally from $24 to $200 represents nearly eightfold expansion and 4.5x appreciation in the last year.
Technical view favors systematic profit booking of at least 65–70% and capital preservation. The $170–$200 zone resembles a probable distribution phase observed over six months.
Overall, Bias: Cautiously Bearish
Recommended Action: Partial exit and trailing stop on remainder
2. CHART STRUCTURE & PRICE ACTION
Major Resistance: $200 – $206
Major Support: $170 / $145 (weekly reference)
Trend Context: Extended rally followed by sideways consolidation
3. MAGNITUDE ANALYSIS
Price Expansion $24 to $ 200 = ~8x Last 1 Year Growth = ~4.5x
4. RISK MATRIX
| Factor | Signal | Risk Weight | Comment |
| $200 Level Retest | Bearish | High | Supply respected twice |
| Historical High 206 | Bearish | High | Breakout failure |
| Large Red Candle | Bearish | Medium-High | Aggressive selling |
| Inside Candle | Bearish | Medium | Continuation context |
| 6M Range | Neutral-Bearish | Medium | Distribution probability |
| Rally Extension | Overbought | High | Profit vulnerability |
Net Risk Score: Elevated Downside Probability (»8.5/10)
5. STRATEGY FRAMEWORK
Book 65–70% profit immediately.
Keep residual 30–35% only for volume supported breakout above 206. Place trailing stop near $170 zone.
6. CONCLUSION
Base case remains bearish within $170– $200 distribution band unless invalidated by decisive breakout above $206 with momentum rebuild.
SOMESH NANDY


