
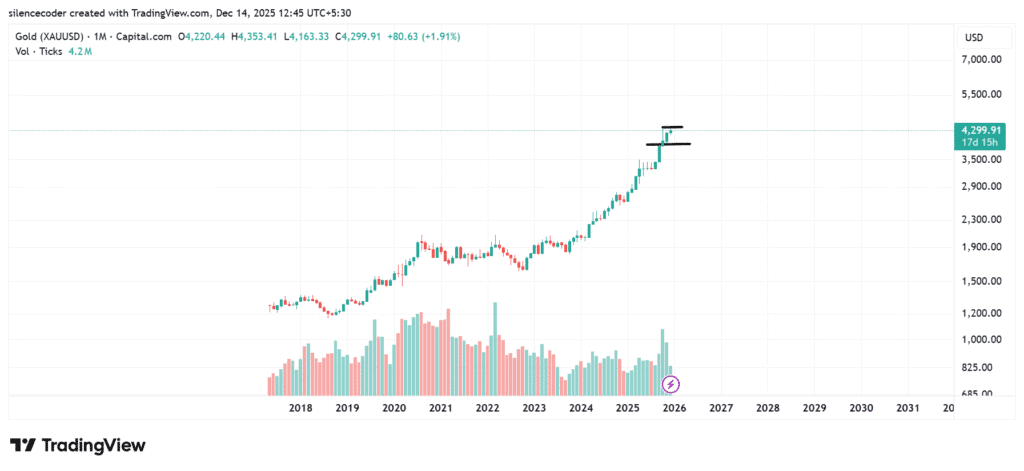
Monthly Chart:
Daily Chart:
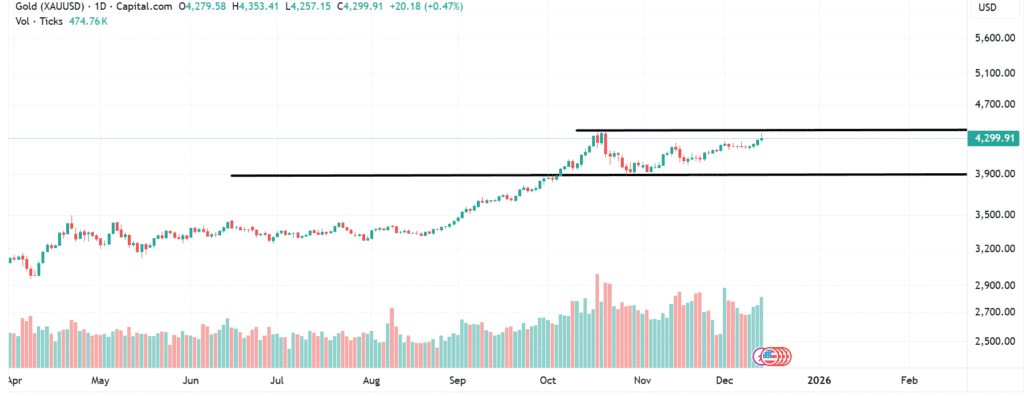
Key Technical Levels
| Level Type | Price Zone (USD) | Technical Significance |
|---|---|---|
| Major Resistance | $3,000+ | Price discovery zone; no historical resistance |
| Breakout Zone | $2,500 – $2,550 | 2024 monthly breakout; strong demand area |
| Structural Support | $2,100 – $2,050 | 2020 all-time high; long-term pivot level |
| Range Support | $1,650 – $1,700 | 2021–2023 consolidation base |
| Cycle Base | $1,200 – $1,350 | 2018 accumulation zone |
Market Phase Classification
| Phase | Time Period | Technical Behavior |
|---|---|---|
| Accumulation | 2018–2019 | Base formation |
| Expansion | 2020 | Breakout & impulse move |
| Consolidation | 2021–2023 | Range-bound digestion |
| Trend Continuation | 2024 | Fresh breakout |
| Price Discovery | 2025 | Parabolic momentum |


